






June to August 2026
Alerts that do something
In the spring we put AI inside every metric. This summer we closed the loop: a firing metric can now open the ticket or page your on-call, not just message a channel. Plus access by group instead of by person, an assistant that builds the metric for you, and a long list of improvements to the builder itself.
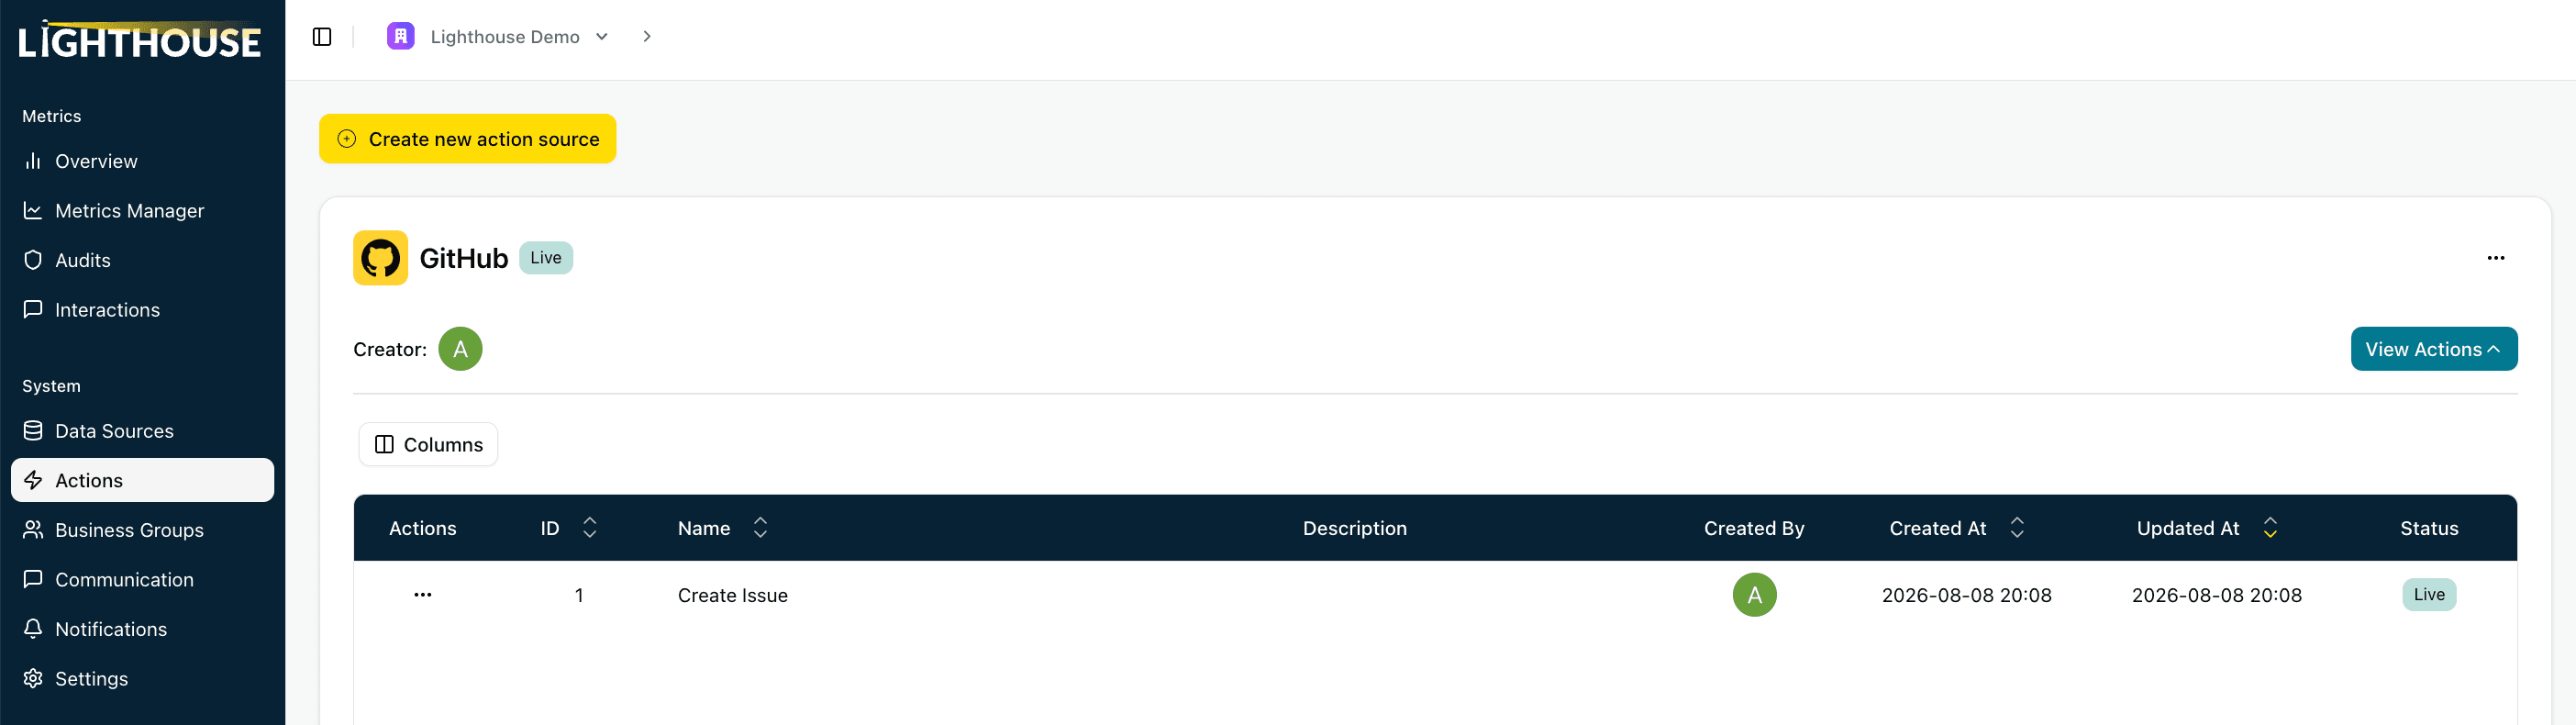
Actions
When a metric fires: open a ticket, page the team, kick off a workflow
Attach an action to a metric and Lighthouse runs it the moment the threshold breaks: opening the GitHub issue or Jira ticket, paging the on-call rota, or triggering anything else your team already uses. Under the hood it's any HTTP endpoint, with the same {{ variable }} context as your notifications. Set it up once, test before you save, and every run is logged.
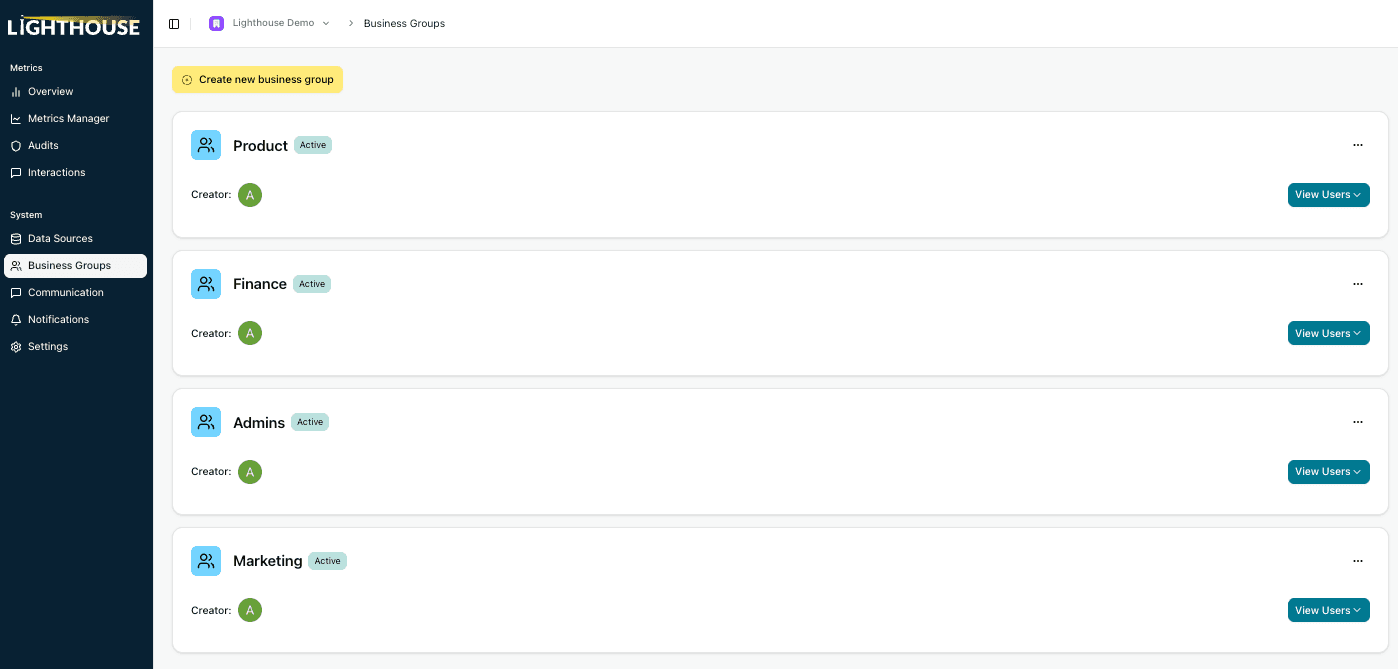
Team access
Give access to a group, not to forty email addresses
Create named business groups (Product, Finance, Marketing) and grant them viewer, editor, or admin access to metrics, data sources, and actions. Membership lives in one place, so people joining or leaving a team doesn't mean editing every metric.
AI assistant
Describe the metric you want, and the assistant fills in the form
Creating a metric now opens an assistant panel that finds the right source, runs read-only exploration to understand your data, and applies a complete configuration straight into the form, which you review before saving. Org admins can audit every AI conversation under Settings → AI.
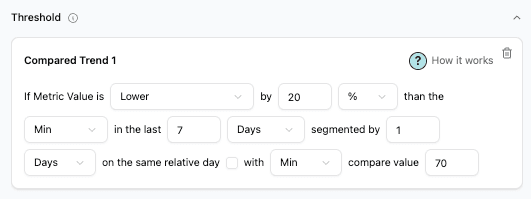
Alerts
Ignore the segments that are too small to matter
Set a min or max compare value on a trend comparison and Lighthouse skips any segment below it, so your smallest regions, plans, and accounts stop firing alerts off a handful of rows.

Integrations
Mixpanel over MCP, and peek events while you build
Mixpanel data sources can now connect through Mixpanel's MCP endpoint instead of the classic API. Pick it under Connection Method. Peek raw events is also one click away inside the metric builder, so you can check a field without leaving your filter.
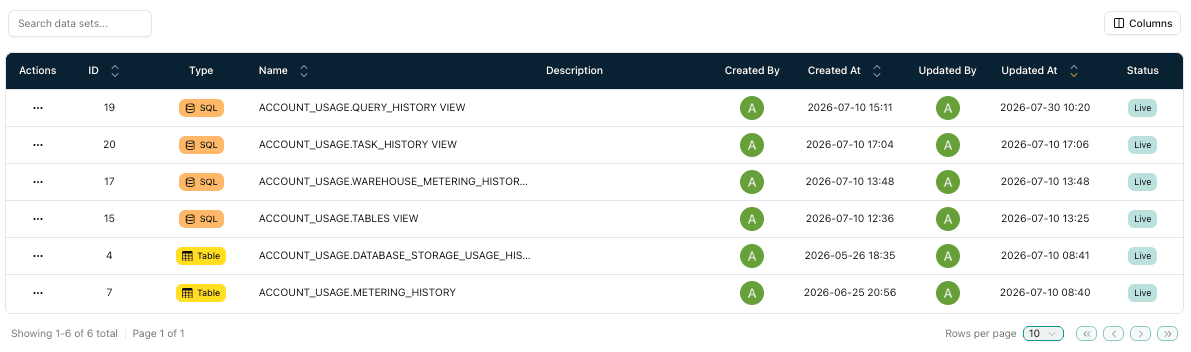
Data sources
Build a data set from your own SQL
On Postgres, Snowflake, BigQuery, and MSSQL you can define a data set as a SQL query instead of picking a synced table. Bring the joins and filters you already wrote. Live for every account.
Also shipped
Improvements across the metric builder
- Alert on individual rows. A new No Aggregation, All Rows option makes each matching row its own metric value, for stuck orders or bad records that a SUM would hide.
- Better time windows. Yesterday as a metric period, plus in the last and in the next on date filters, and segment filters can now test the segment columns themselves, so test accounts never alert.
- 30-day history for every account. The preview chart is no longer behind a flag, and now shows how many times the threshold would have been met in the last 30 days.
- Mute a metric without pausing it. Turn notifications off on a metric and it keeps running and keeps firing actions; it just stops messaging the channel.
- Auto-suggest metrics on new data sets. Opt in under Settings → AI and every new data set starts generating metric suggestions on its own.
- Big Slack alerts send again. Wide segment tables used to exceed Slack's block limit and fail silently. They now truncate and deliver.
- % Change as a notification variable. Reference the trend percentage directly in your alert copy.
- Larger, faster previews. Test Metric returns up to 10,000 rows and paginates results, so wide previews no longer freeze the tab.