
Never miss a critical metric again.
Describe a metric in plain English.
Get pinged in Slack the moment it moves.
- Free forever tier
- No credit card
- Read-only access
Works on





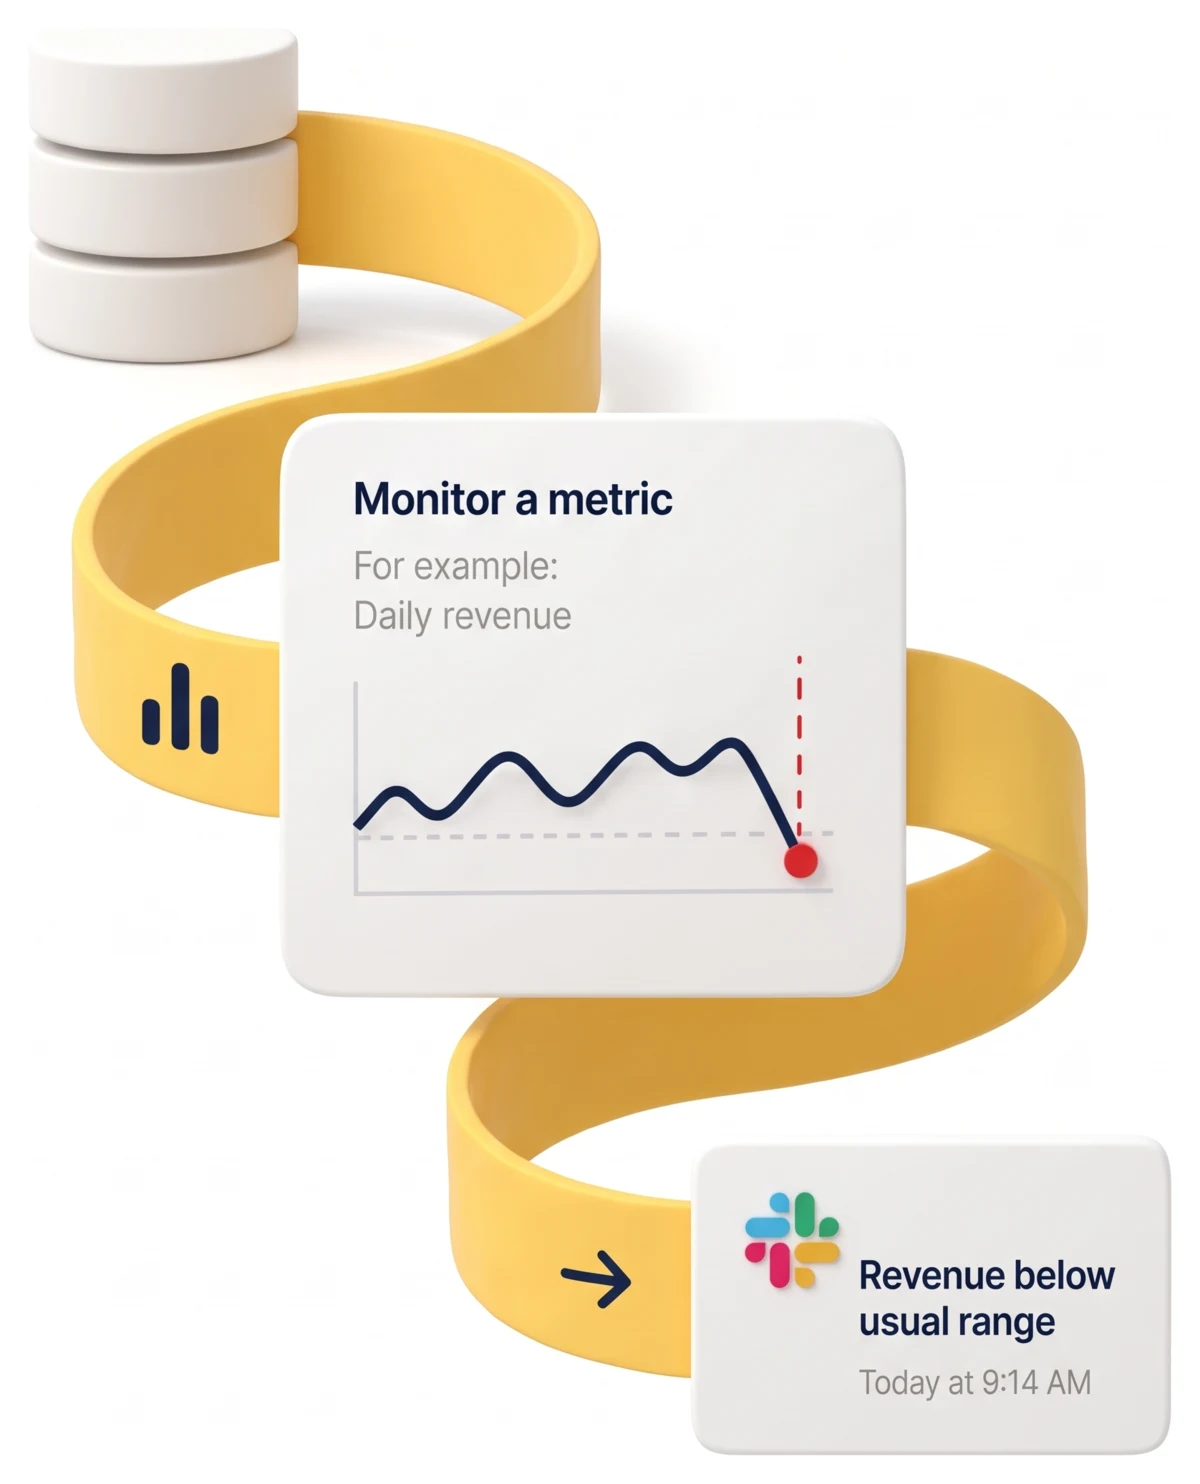
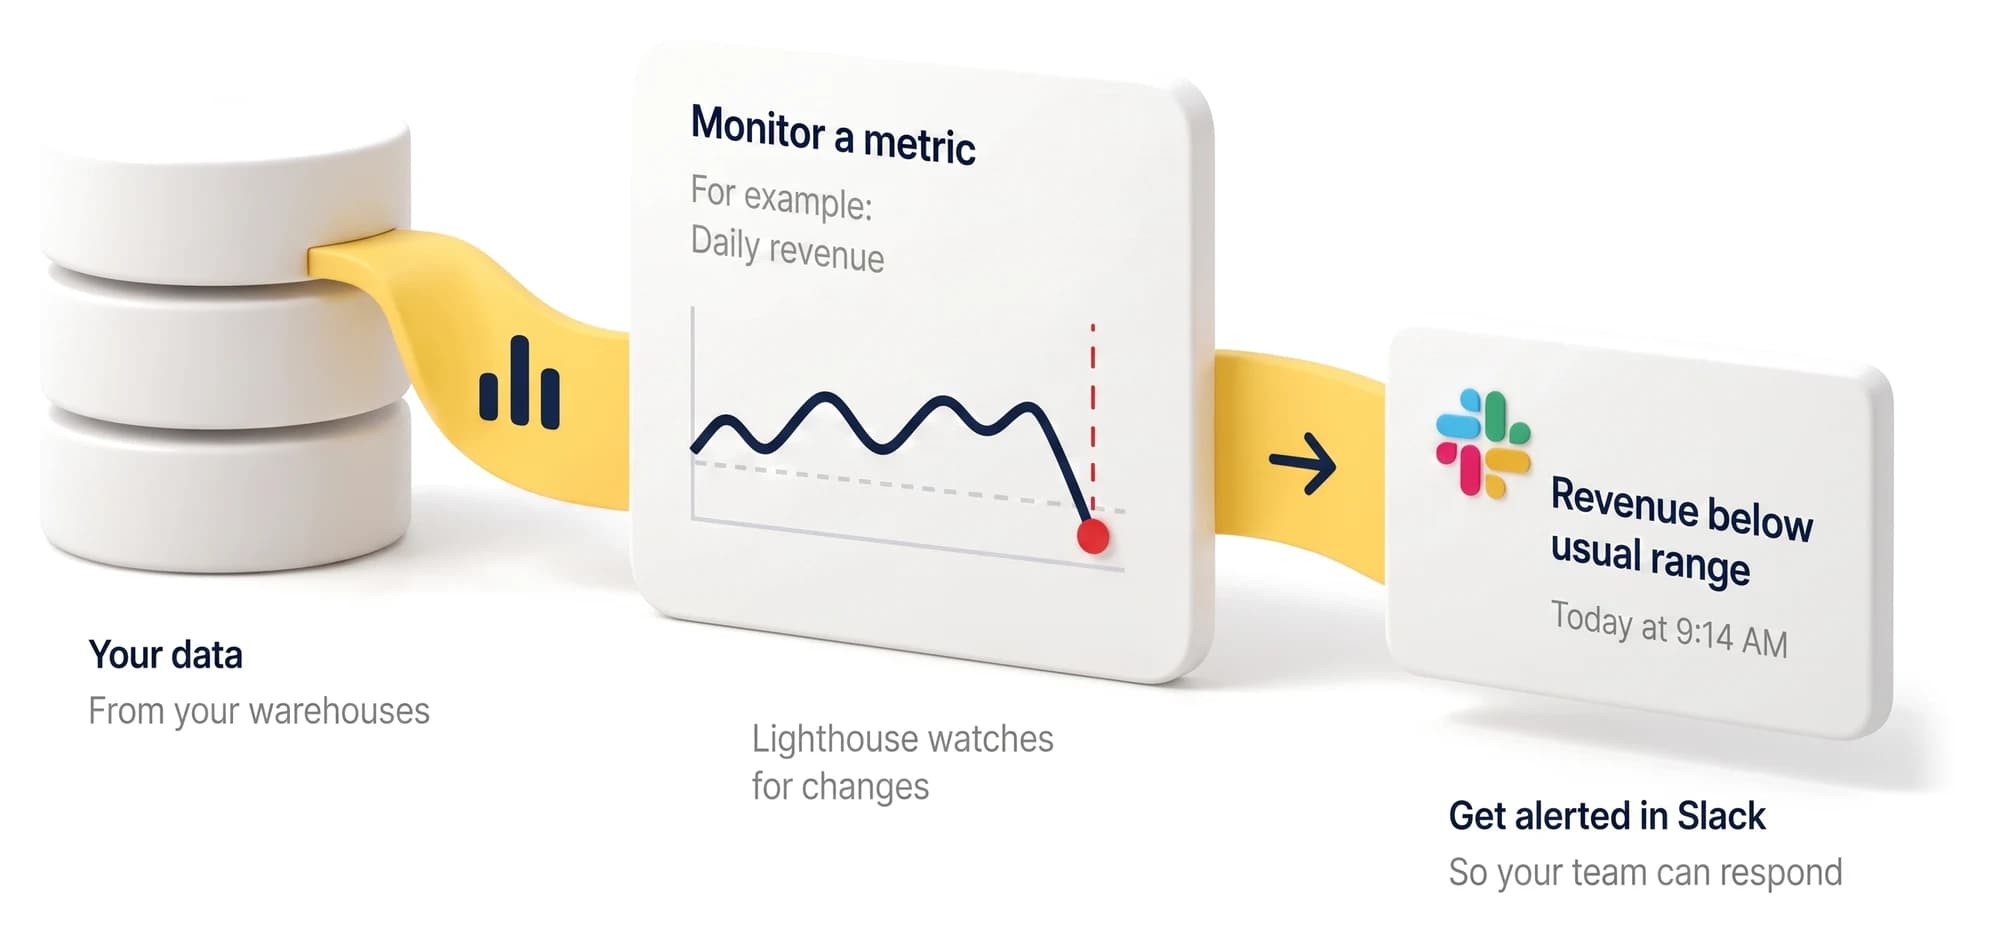


Describe a metric. Watch it come alive.
Plain English in. SQL, thresholds, and Slack alerts out.
 Lighthouse/ Metrics / New metricDraft
Lighthouse AI
Metric copilot
Hi. Describe a metric in plain English and I'll set it up: SQL, thresholds, and a Slack alert.
Untitled metric
myco.analytics.kpi_events-- SQL appears here
Metric · last 4 weeks, same day-of-week
Baseline learnedLighthouse learned your baseline: volume averages 3,240 txns this window, same day of week.
From warehouse to alert in minutes. Not sprints.
Connect your warehouse.
Read-only. We never write to your warehouse.
Point Lighthouse at Snowflake, BigQuery, Postgres, or SQL Server. Read-only credentials. Lighthouse never writes to your warehouse or copies your tables.
Select your warehouse
Pick a dataset. Let AI suggest metrics.
Lighthouse scans your columns and proposes what to monitor.
Point at a table or view. Lighthouse reads the schema and proposes the metrics teams like yours actually watch, based on column types, cardinality, and patterns across thousands of datasets.
AI suggestions · transactions table
Transactions volume, last 3 hrs
App errors, last 10 min
Active users, last 10 min
Signups per hour
Checkout conversion rate
API request volume spike
Revenue per session, daily
Customer churn rate, monthly
Sit back. Get pinged when something matters.
Adaptive thresholds. Zero noise. Real signals only.
Lighthouse watches every metric continuously, learns seasonal patterns and normal ranges, and alerts in Slack only when something genuinely moved. Fewer alerts than you have today, and every one will mean something.
Recent alerts · #data-alerts
Transactions volume, last 3 hrs triggered
2 min agoActive users, last 10 min
31 min agoYour analysts know what to watch. Lighthouse makes sure they never miss it.
Transactions, sessions, events, clicks: Lighthouse watches the KPIs behind them and pings you the moment one moves.
Gaming
Live revenue, player health, tournament integrity
Cash tournament RTP, last 60 min
S1FinanceActive players, last 10 min
S2UsersIn-app purchase volume, hourly
S1RevenueMatch-making wait time, 5 min
S2UXPush notification delivery rate
S2ProductCash withdrawal rate, last 3 hrs
S1FinanceLighthouse auto-suggests these based on your schema. You pick what to monitor.
Connect your dataFewer false alarms. Zero missed issues.
Lighthouse reviews your alert history and suggests fixes that cut the noise, but never one that would have missed a real issue.
95%
noise reduction, one metric
0
true positives missed
30d
of history analyzed
What the AI examines
- Threshold positioning vs. confirmed true/false positives
- Consecutive-match gate (filters 1-run spikes)
- Window size vs. event-count variance
- Day-of-week & hour-of-day baseline drift
- Snooze deduplication for long-running episodes
Checkout Revenue Rate · Last 60 min
Finance · S1 · Every 1 hr, 10 past each hour
AI audit complete
Add minimum value condition (> 0.3)
↓ 95%Metric fires on micro-fluctuations near zero. Adding AND value > 0.3 eliminates statistical noise below meaningful levels.
Enable trigger after 2 consecutive matches
↓ 56%14 of 25 triggers were 1-run spikes that self-resolved within the next window. No confirmed true positive had episode length < 2.
Enable trigger after 3 consecutive matches
↓ 72%18 of 25 historical triggers recovered within 2 runs. All 7 confirmed true positives stayed matched for 3+ consecutive runs.
Applying suggestion #1 alone would reduce triggers from 157 to 8, a 95% drop with no confirmed true positives at risk.
16 of our analysts use Lighthouse daily to monitor the metrics that drive our products. It's become the layer that sits between our warehouse and our stand-ups.
Analytics Lead
A leading gaming company · 50M+ users
10x
fewer alerts than before
10 min
avg. setup time
0
engineering tickets to add a metric
Lighthouse is not…
Not Datadog.
Datadog watches your servers. Lighthouse watches your business. Different data, different audience, different kind of alert.
Not Monte Carlo.
Monte Carlo scans your tables for nulls, schema drift, and freshness issues. Lighthouse monitors your KPIs and business metrics: the signals your stakeholders actually care about. You can also use Lighthouse for technical metrics. But that's your choice, not its default.
Not another BI dashboard.
Dashboards wait for you to come to them. Lighthouse comes to you, in Slack, at the moment something actually moved.
Not an "AI analyst."
We don't replace your analysts. We remove the parts of their day spent babysitting dashboards and chasing false alarms.
Built for teams that can't afford to get this wrong.
Read-only by design.
We connect with read-only credentials and only pull schema for dataset definitions. Your data stays in your warehouse.
Your metrics, your data.
We process only the metrics you define. We don't explore your warehouse, mine your data, or store query results.
SOC 2 readiness in progress.
Trust center, security policies, and PwC auditor engaged. Built for teams where compliance is non-negotiable.
View trust center

Common questions
What is Lighthouse?
How is Lighthouse different from data observability tools?
Which data sources does Lighthouse connect to?
Do I need to know SQL?
Where do alerts go?
Is my data safe?
How much does Lighthouse cost?
How long does setup take?

Start monitoring what actually matters.
Free forever for small teams. Connect your warehouse in under 10 minutes. Upgrade if and when you outgrow it.
No credit card required · Read-only access · Cancel anytime